The physics behind
Lung functions can be expressed through measures of pressure and flow. A variety if indices can be derived from these measurements. Click on them to learn more!
Important bits to start
equation of motion
Airway pressure is the sum of pressures generated by the ventilator and the patient's muscles.

Let's assume the patient does not generate any pressure (e.g. is paralysed) then:


Compliance expresses the change in volume for a given change in pressure. It is altered by disease.
Resistance is defined by Ohm's law and is an expression of how much pressure is needed to generate flow.


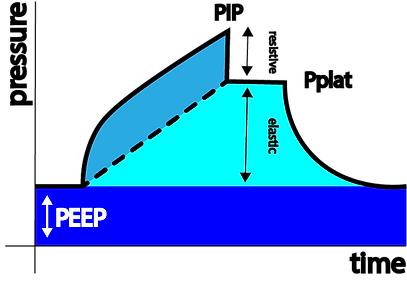

Describes the pressure needed to overcome the elastic forces of the respiratory system (see below)
Describes the pressure needed to overcome the resistive forces of the airway (see below)
In the above figure of a volume controlled breath using a square flow pattern, PIP (Peak Inspiratory Pressure) is the sum of the pressure needed to overcome the resistive forces (grey) and the pressure needed to overcome the elastic forces (cyan) plus PEEP. There is no PEEPi in this example.
Once the flow stops during inspiration, the pressure equilibrates to Pplat (Plateau Pressure) representing the alveolar pressure.

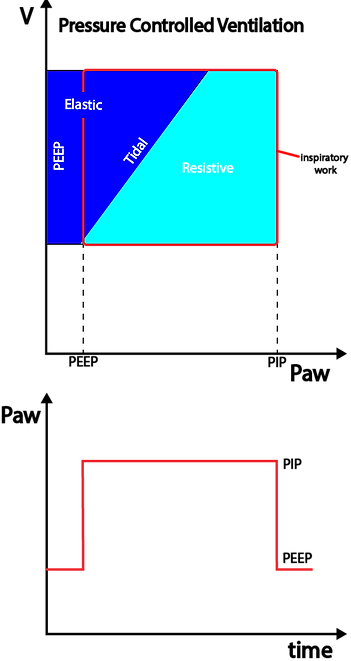
In the above figure of a pressure controlled breath the ventilator will constantly adjust flow in order for the PIP to remain at the target value set by the operator while the flow needed to achieve the set pressure depends on C and R within the respiratory system. The generated TV is the dependent variable and differs with changes in C and R.
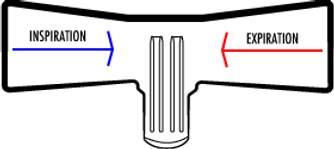
Linear resistance pneumotachograph

A gas stream is forced through an array of miniature tubes representing a given resistance (R). Pressures are measured on either side of the tubes (P1 and P2), their difference is ∆P. Using Ohm's equation, an algorithm calculates flow as ∆P = R x I and I = ∆P/R.
Ultrasound Flowmeter

Two Piezo crystals alternate in sending and receiving ultrasound signals at a rate of 40 - 200kHz. Their transit time to reach the other crystal is changed by the flow of the medium they travel through. This change in time of flight allows for calculation of the medium's velocity and therefore flow.
Hotwire anemometer
Hot wire anemometers use a fine wire which is electrically heated to a set temperature. Air flowing past the wire cools it. As the electrical resistance of the wire is dependent upon its temperature according to Ohm's law (U=R x I), the flow can derived.
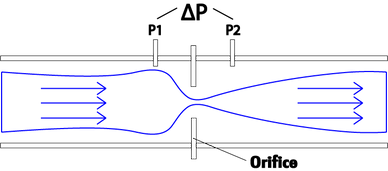
Orifice flowmeter
Orifice meters have an orifice plate placed inside a pipe where gas flows. The flow of gas through the orifice causes a pressure drop between up- and downstream of the obstacle. The pressure difference ∆P is picked up by sensors and an algorithm based on the Bernoulli equation allows for calculation of flow.
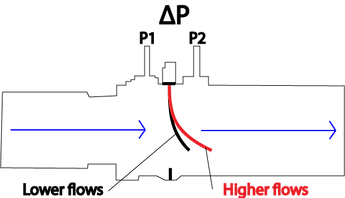
Variable orifice flow sensors overcome the biggest limitation of the fixed OM which ist the effect of water condensation caused by the difference between body and ambient temperature.
This is done by including a flexible flap that is cut in the middle and placed into the gas stream creating an opening that widens with increase in flow. This creates an automatic mechanical linearization between P and Q. The flap of the orifice will enlarge with Q avoiding the increase in resistance
variable Orifice flowmeter
Alveolar Pressure
During volume controlled ventilation, alveolar pressure during inspiration is determined by the volume delivered and the respiratory system compliance plus PEEP.

During pressure controlled ventilation, alveolar pressure during inspiration can be calculated using this formula:


plateau pressure
While flow is present during inspiration, the proximal airway pressure will always be greater than the alveolar pressure. The latter can be estimated using an end-inspiratory hold manoeuvre for 1-2 seconds in volume controlled ventilation. Once the flow stops the pressure equilibrates throughout the respiratory system and and pressure measured at the proximal airway is a good measurement of alveolar pressure.
As the flow stops at the end of inspiration the proximal airway pressure drops initially to Pz (pressure at zero flow). The difference between Pz and Pplat is determined by the visco-elastic properties of the lung tissue and the difference in time constants within different areas of the lungs (--> different lung areas take variable amounts of time to equilibrate to changes in pressure)

During pressure controlled ventilation the flow may or may not decrease to zero. If it does then PIP=Pplat (above left).


For any given tidal volume the Pplat will increase with a decrease in compliance and vice versa. A patient's compliance will change over time and one needs to be aware of its consequences.
Mean Airway Pressure
Mean airway pressure (MAP) is determined by PIP, the time spent in inspiration and PEEP.


Given the pressure curve during VC ventilation resembles a triangle the MAP can approximated like this:

Given the pressure curve during PC ventilation resembles a square the MAP can approximated like this:

auto-PEEP (=Intrinsic peep)
Auto-PEEP refers to dynamic hyperinflation of the lungs during mechanical ventilation that is due to incomplete emptying during expiration.
Auto-PEEP is influenced by ventilator settings and lung properties (R and C).
It can be estimated using an expiratory hold manoeuvre without respiratory effort by the patient during which flow = 0 and the proximal airway pressure equilibrates with the alveolar pressure. The difference between the measured PEEPtot and the set PEEPe on the ventilator equals Auto-PEEP (PEEPi).
Auto-PEEP can be underestimated if parts of the airways collapse during expiration and therefore trap air behind the closed airway. This happens in patients with significant small airway obstruction such as ventilated asthmatics.


• Pressure, flow and volume during PC ventilation with insufficient time for expiration causing intrinsic PEEP and dynamic hyperinflation.

In a spontaneously ventilating patient, PEEPi can be estimated using oesophageal pressure measurement (Pes).

According to the above formula Auto-PEEP increases with increased tidal volume, resistance, compliance, respiratory rate and inspiratory time. It can be decreased by reducing minute ventilation (RR or TV), inspiratory time (lowering I:E ratio) or decreasing Raw (eg. bronchodilators)

Esophageal Pressure
Pleural pressure cannot be measured in an ICU setting. An alternative approach to estimating pleural pressure (Ppl) is to measure oesophageal pressure (Pes) using a balloon catheter that is placed in the distal third of the oesophagus.
Review the different pressures that we use in bedside respiratory mechanics by clicking on the button below.
TRans-pulmonary pressure
Transpulmonary pressure is the true lung distending pressure. It is equivalent to the alveolar pressure minus the pleural pressure. The latter can not be measured directly. Oesophageal pressure measurement is used as a surrogate for pleural pressure and therefore calculation of transpulmonary pressure.
This allows to measure the true lung distending pressure by excluding the contribution of extra pulmonary tissues in the respiratory system such as the chest wall and the abdomen.
A positive transpulmonary pressure causes the lung to be pushed outwards while a negative transpulmonary pressure causes the lung to collapse.
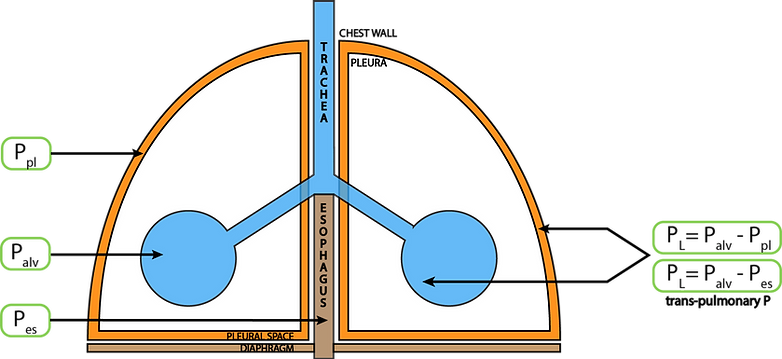
During ventilation the settings should be chosen in order for the trans-pulmonary pressure during expiration to avoid lung collapse and not excessively positive at the end of inspiration to avoid over distension.
Trans-pulmonary pressure can be measure at the end of inspiration and at the end of expiration.

abdominal pressure
The diaphragm separates the abdominal from the thoracic cavity. Given it is not rigid, pressure changes in either compartment will influence the other. In general, approximately 50% of abdominal pressure is transmitted into the chest.

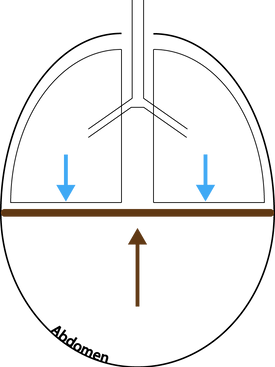
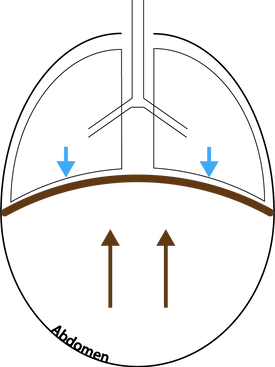
Abdominal pressure can be measure indirectly by measuring the bladder pressure with a transducer system. Normal pressure is < 5mmHg. Inspiration increased while expiration decreases abdominal pressure. In deeply sedated or paralysed patients where the diaphragm moves passively, increased abdominal pressure is transmitted to the lower lung segments, causing atelectasis. In a ventilated patient, an increase in abdominal pressure causes a decrease in the respiratory system compliance (Crs) by decreasing the chest wall compliance (Ccw) - this leads to a rightward shift and flattening of the P-V loop.
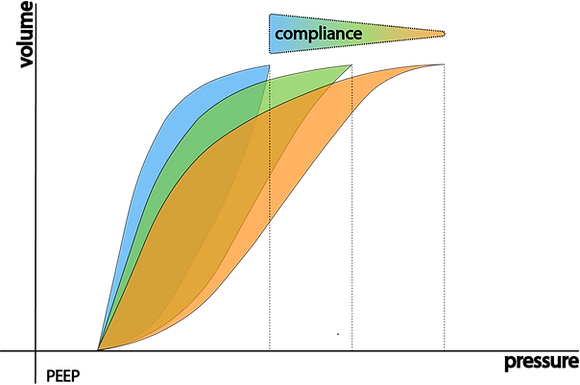
As the compliance decreases you need more pressure to achieve a particular volume.
In other words:
For any given pressure the volume you achieve increases with increasing compliance.
trans-diaphragmatic pressure
During spontaneous ventilation pleural pressure (Ppl) decreases during inspiration while abdominal pressure increases and vice versa during expiration.
The trans-diaphragmatic pressure i the difference between abdominal and pleural pressure.


Time constant
The time constant (𝜏) helps us understand how much time is needed for a lung unit to in- or deflate. 𝜏 is the product of compliance and resistance and therefore changes with disease. Its unit is seconds.


As the lung in or deflates its volume changes according to the following formula.
The graphs shows the change in percentage of initial volume over time for inspiration (blue) and expiration (green).
Lung units with a higher resistance and/or compliance will have a higher time constant and take longer to equilibrate to a new level of in- / deflation.
Examples
- Long TC: Asthmatic due to high R
- Short TC: Premature baby with RDS and low C
A simple method to approximate 𝜏 during positive pressure ventilation without patient effort is to use the following formula:


This method assumes the lung to be homogenous which is never the case but mathematically is a valid approximation.

end-expiratory lung volume
End-expiratory lung volume (EELV) during mechanical ventilation is equivalent with Functional Residual Capacity (FRC) in a spontaneously breathing person.
It can be measured using a nitrogen washout technique.
The nitrogen washout technique works on the principle of mass conservation - in this case, the nitrogen within the patient's lungs. The subject breathes on a mouthpiece that is connected to an inspiratory source of 100% oxygen while the subsequent exhaled gas is directed into a collection bag, previously flushed with oxygen. The resident nitrogen is washed out of the lungs progressively and monitored with continuous analysis at the mouthpiece. When the exhaled nitrogen concentration falls below 2%, the test is ended, and the volume of nitrogen collected is measured. The FRC can be calculated on the basis that this nitrogen volume represents 79% of the lung gas contained at the beginning of the test.
respiratory system compliance
The respiratory system compliance (Crs) is the sum of the chest wall and lung compliance.


Chest wall compliance
Chest wall compliance can be calculated by measuring pleural pressures during passive inflation. Esophageal pressure is used as a surrogate.
Ccw increases with flail chest and paralysis and decreases with chest wall oedema, chest wall burns, abdominal hypertension and thoracic deformities (eg. scoliosis).


Lung compliance
Lung compliance can be calculated using transpulmonary pressure.
Ccw decreases with ARDS, pulmonary oedema, pneumothorax, consolidation, atelectasis, fibrosis, pneumonectomy, bronchial intubation and over distension. Pulmonary compliance decreases with emphysema.


Stress index
The stress index can be used during constant-flow volume controlled ventilation. It describes the shape of the pressure curve during inspiration and therefore changes in compliance.

If C is constant during inspiration --> Stress Index = 1
If C decreases during inspiration --> Stress Index > 1
If C increases during inspiration --> Stress Index < 1
During ventilation the aim is to achieve a stress index of 1.
- If SI > 1 the recommendation is to decrease the PEEP and/or TV
- If SI < 1 the recommendation is to increase PEEP
inspiratory flow
During volume controlled ventilation inspiratory flow is fixed (square flow curve) while PIP and Pplat are dependant.
During pressure controlled ventilation the inspiratory flow can be calculated using the following formula:


expiratory flow
Expiration is normally passive and the flow determined by the alveolar pressure, the airway resistance, the elapsed time and 𝜏. The expiratory flow at any time can be approximated using the following formula:

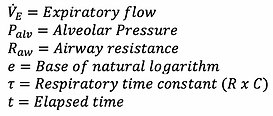
End-expiratory flow is present if there is insufficient time to complete expiration (eg. high Raw or short expiratory time). This can cause Auto-PEEP!

Watch out for changes in the expiratory flow. An example of missed triggering attempts by the patient is shown below.
Tidal volume
Volume is integrated from measuring flow over time. The solid area under the flow curve for pressure controlled and volume controlled ventilation is equivalent to the tidal volume (TV).


Pressure controlled ventilation (decelerating flow)
Volume controlled ventilation (constant flow)
Watch out for a difference between in- and expiratory tidal volumes which is consistent with a leak. Check the circuit and the patient which may experience air leak (pneumothorax, bronchopleural fistula...). If the leak is around the ETT and does not diminish by inflating the cuff you should consider changing to a pressure controlled mode.
Relationship among compliances


airway resistance
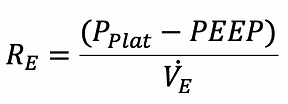
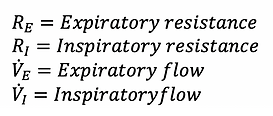
Airway resistance influences in- as well as expiration. During volume-controlled ventilation the resistance can be calculated as follows:
During pressure control ventilation the flow is variable given the set pressure. The resistance can therefore not be calculated.

Work of breathing
The term work of breathing (WOB) appears straightforward - but there are different ways to approach its quantification.
One way is to measure the respiratory muscles O2 consumption (energy cost) and thus their share in an individuals's metabolic requirements. Another approach is to measure the mechanical work either provided by the respiratory muscles in a spontaneously ventilating patient or applied by a ventilator in a patient needing respiratory support.
total energy cost of breathing
Mechanical work OF breathing
The energy used for breathing can be approximated by the following set-up:
Using indirect calorimetry the O2 consumption can be measured at rest and with increased breathing effort respectively. The difference in the two measurements can is due to the increased energy consumed by the "breathing machine".
At rest, the O2 consumption for breathing is around 0.5 - 2 ml O2 per liter of minute volume.
WOB increases with decreased compliance and increased resistance. It can be calculated by adjusting the equation of motion and represented using pressure volume graphs:
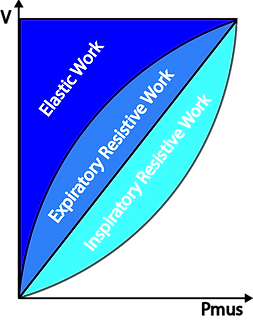
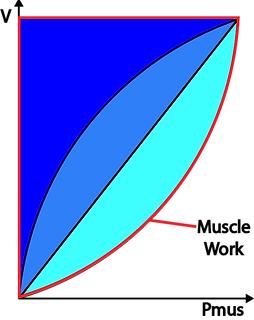


During spontaneous ventilation the respiratory effort needs to overcome the resistive forces of the airway as well as the elastic forces of the lung characterised by the compliance. The graphs show how the WOB divided into resistive inspiratory, resistive expiratory and elastic parts.
Under normal circumstances the work performed during expiration can "feed off" the energy stored as elastic recoil in the tissues after inspiration. This is the case in the above graph as the are for resistive expiration is smaller than the area of elastic work.
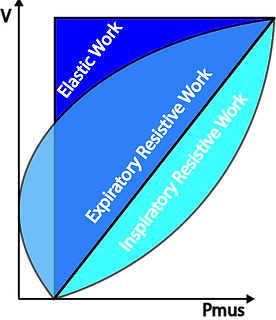
During active or forced expiration the work needed to overcome the resistance can become greater than the energy stored in the tissues --> The expiratory resistive work becomes larger than the elastic work.
This red lines circumscribes the total work done by the muscles during inspiration in a spontaneously breathing individual.

work of breathing during positive pressure ventilation
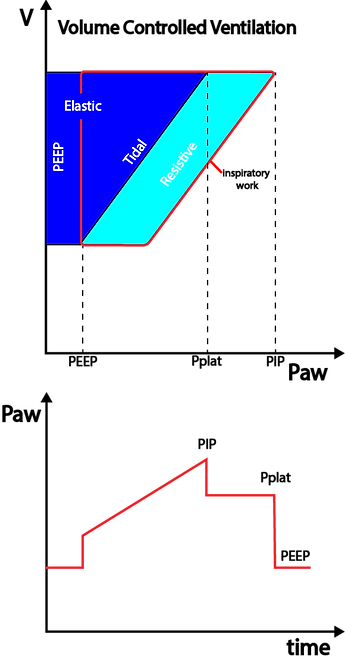
Theoretical estimation of the WOB
Otis states that for any given alveolar ventilation there is an optimal respiratory rate characterised by minimal work of breathing. With increasing respiratory rate the fraction of dead space ventilation relative to total ventilation increases. The work used for dead space ventilation is "wasted work" and diminishes efficiency of the the WOB. On the other hand, WOB increases with lower respiratory rates as per the above formula. This leads to a complex interaction of different factors and the best equilibrium can be estimated using complex maths.


The first part of the equation represents elastic work while the second and the third part represent non-elastic work. The latter two are independent of the respiratory rate. According to the above, WOB increases with elastance and decreases with the respiratory rate. CAVEAT: This formula is only applicable to low or moderate amounts of ventilation in which expiration is passive, furthermore, it represents total and not alveolar ventilation and does not account for dead space ventilation.

Optimal frequency of breathing
At higher ventilation with active expiration the equation changes to:

As per the above formula the non-elastic work increases with the respiratory rate simply because there is more total ventilation. If only non-elastic work was involved, the lowest breathing rate would yield the lowest WOB.
Changing in frequency influence the elastic part of WOB in two ways:
1. A higher rate increases the elastic work because there is more dead space ventilation
2. A higher rate decreases elastic WOB because the tidal volumes are smaller
Taking this into account, there must be an optimal rate at which the sum of the two effects lead to minimal WOB.
Adding non-elastic WOB into the calculations will yield a lower optimal rate than with just elastic WOB.
Applying the above equation leads to the following conclusions for a given alveolar ventilation:
1. The optimal frequency will decrease with increasing dead space
2. The optimal frequency will decrease with increasing non-elastic resistance
3. The optimal frequency will decrease with increasing compliance
4. The optimal frequency will increase with increasing alveolar ventilation
In physiology the respiratory rates predicted by Otis' formulae is in keeping with the body's choice for a given minute volume.

Pressure-Volume curves + Loops
In P-V loops volume is displayed as a function of pressure. The slope of the P-V loop is equivalent to Crs. P-V loops are best measured using constant flow such as used in VC ventilation. The loops can be used at the bedside to assess pulmonary mechanics or as part of a slow inflation technique used on modern ventilators to assess recruitability and inflection points to help guide PEEP setting (--> optimal PEEP). The assessment treats the respiratory system as one compartment disregarding the inhomogeneity of the lungs and not differentiating between pulmonary and chest wall effects.
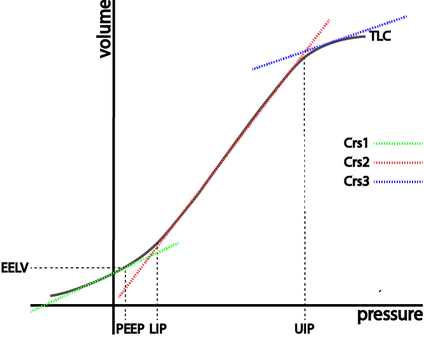
The compliance changes over time indicated by Crs 1/2/3. It is maximal during the steep middle segment of the P-V curve.
The lower inflection point (LIP) is thought to represent the pressure at which a large number of alveoli are recruited.
The upper inflection point (UIP) is thought to represent over distension or - in other words - exhaustion of alveolar recruitment. Beyond the UIP, additional pressure yields almost no further alveolar recruitment and therefore volume.
EELV - End-expiratory lung volume
PEEP - Positive end expiratory pressure
TLC - Total lung capacity
LIP - Lower inflection point
UIP - Upper inflection point
Crs - Respiratory system compliance
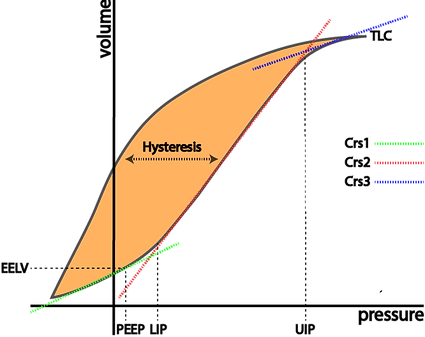
If lungs are slowly inflated and then deflated, the inspiratory curve differs from the expiratory. This phenomenon is present more or less in all elastic bodies and is known as hysteresis. It describes the tissues' property to be reluctant to accept deformation under stress and - once deformed - their reluctance to return to the original state.
In ventilation - this allows to reduce pressure after recruitment while maintaining lung volume, thereby reducing the energy/power applied to the tissues.
The orange are describes the volume gained through hysteresis for a given pressure.
Hysteresis
Flow-Volume Loops
These graphs display flow as a function of volume. Some authors define inspiratory flow as negative flow and some as positive flow. For the purposes of this webpage we consider inspiratory flow negative.
Analysis if the above graphs can be helpful in identifying flow limitations, presence of secretions and response to bronchodilators.
Excessive secretions produce a sawtooth pattern during both in/ and expiration.

Stress is a force applied to an area.
Force applied at an angle generates shear stress.
Strain is the physical deformation caused by stress.
Elasticity allows the deformed object (caused by stress) to return to its original shape or form.
Stress is equivalent to trans-pleural pressure (PL).
Strain is equivalent to TV/FRC (without PEEP).
Stress and strain


Strain is considered harmful if > 2 from which one can derive that harmful stress must be a trans-pulmonary pressure of > 27cmH2O! This value can only be obtained using an oesophageal balloon.
Patient-induced Self-inflicted lung injury (P-SILI)
During positive pressure ventilation in moderate to severe ARDS spontaneous breathing efforts can cause harm to the lung tissue by increasing the trans-pulmonary pressure as the negative pleural pressure generated by the patient is added to the airway pressure generated by the ventilator.
This can occur using an airway pressure that might otherwise be considered safe. The only way to asses for this phenomenon is by using oesophageal pressure measurement to calculate trans-pulmonary pressure.
This phenomenon seems to be more prominent in the dependent parts of the lungs and, given the inhomogeneity of sick lungs, can be exacerbated through regional over-distension of non-collapsed lung.


Tension-Time Index
The tension time index (TTI) has been used to predict diaphragmatic fatigue.


Calculation of Pdi needs measurement of esophageal AND gastric pressure (= trans-diaphragmatic gradient) which is rarely done.
Pressure-Time Product
PTP accounts for energy consumption during dynamic AND isovolumetric work of the respiratory system as opposed to WOB which only accounts for work during which volume changes.
PTP is the time integral for the difference between Pes and the recoil pressure of the chest wall.
The oxygen consumption of the respiratory muscles (often called metabolic WOB) is only weakly correlated with the mechanical WOB whereas it is well reflected by the PTP.
The chest wall elastance is the reciprocal of its compliance which can be calculated as described above.
Stress raisers
Stress raisers describe a concept where an area of lung adjacent to a collapsed area is exposed to more force and therefore stress and strain.
This concepts is true for inhomogeneous lung disease found in ARDS and other entities. The consequence of this redistribution of force is that despite an overall acceptable Pplat and trans-pulmonary pressure, some areas undergo excess stress and strain.

Under normal circumstances, all alveoli are distended equally and the applied force is the same in all units.

In this case the centre alveolus is collapsed. The surrounding lung units are distended more and receive a higher amount of force causing increased stress and strain.
Mead et al. came up with a formula that lets one calculate how much stress raisers increase the pressure / stress / strain on adjacent non-collapsed tissues.


The forces generated through redistribution secondary to partially collapsed airways can get incredibly high as the below example demonstrates:
Let's assume there are 100mls of inflated and 20mls of deflated lung (=20%).


Applied to the formula above this yields an almost 3-fold increase in the applied trans-pulmonary pressure!!!


